WORK
SHEET
#3
SUPPLY and DEMAND GRAPHS

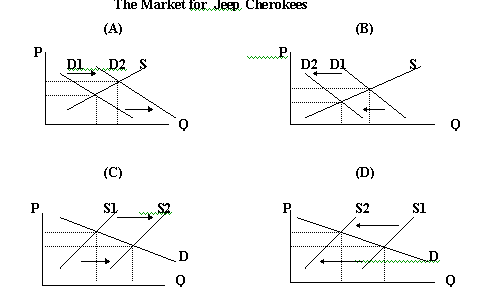
Which graph above correctly illustrates the market adjustment that occurs in each situation that follows?
1. New robotic technology on factory production lines lowers the average cost of production for each Cherokee produced.
a. (A) b. (B) c. (C) d. (D) e. none 2. The price of Ford Broncos (a competitor) falls.
a. (A) b. (B) c. (C) d. (D) e. none 3. Consumers incomes rise due to prolonged growth in the economy.
a. (A) b. (B) c. (C) d. (D) e. none 4. The price of insurance for Cherokees drive vehicles triples.
a. (A) b. (B) c. (C) d. (D) e. none 5. The government places a $2000 tax per vehicle on the production of all sports utility vehicles (including Cherokees) to discourage the production of low mileage cars.
a. (A) b. (B) c. (C) d. (D) e. none 6. A new union contract raises wages at Jeep Cherokee plants.
a. (A) b. (B) c. (C) d. (D) e. none 7. The price of gasoline rises to $5.89 per gallon.
a. (A) b. (B) c. (C) d. (D) e. none 8. The National Highway Safety Council releases a warning that tests and accident reports indicate that Sports Utility Vehicles, including the Jeep Cherokee, have a high rate of rolling over and are unsafe for small children and seniors as a result.
a. (A) b. (B) c. (C) d. (D) e. none 9. Cherokee prices are expected to rise in the near future.
a. (A) b. (B) c. (C) d. (D) e. none 10. Due to a successful, extended ad campaign consumer preferences become more positive for the Jeep Cherokee.
a. (A) b. (B) c. (C) d. (D) e. none

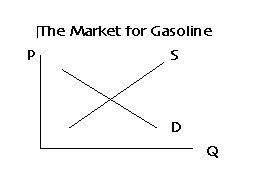
11. Refer to the graph immediately above. A new technology allows the costs of gasoline refining to fall by 50%. This will result ina. the demand curve shifting inb. the supply curve shifting in
c. the demand curve shifting out
d. the supply curve shifting out
12. The new equilibrium will be reached whena. Supply falls and price risesb. Supply rises and price falls
c. quantity supplied rises and price rises
d. Demand rises and price falls
13. Refer to Graph 1 above. Start over at equilibrium. Due to a technological breakthrough it is discovered that automobiles can now run on recycled cooking oil at half the price of gasoline. What adjustment will occur in the graph?a. The demand line for gas will shift out, to the right.b. The quantity supplied of gas will decrease due to a left shift of the Demand curve.
c. The supply line for gas will shift in, to the left
d. The supply line for gas will shift out, to the right.
14. This adjustment will causea. the price of gas to fall and output to increaseb. the price of gas to fall and output to decrease
c. the price of gas to rise and output to decrease
d. the price of gas to rise and output to increase
15. "Movements along a Demand curve", refer toa. a rightward shift in the Demand curveb. a leftward shift in the Demand curve
c. changes in the quantity Demand
d. an increase in Demand
a. The price of chicken falls.
b. Health conscious consumers substitute tofu for chicken in their diets.
c. The nesting costs of chicken farmers increase.
d. New breeding technologies lowers the costs of production of chicken farmers.
e. Newspaper warnings of salmonella bacteria frighten consumers.
17.
At prices above the
equilibrium price, quantity demanded is:
a. less than quantity supplied, forcing prices down.
b. less than quantity supplied, forcing prices up.
c. greater than quantity supplied, forcing prices down.
d. greater than quantity supplied, forcing prices up.
18.
A price floor
a. restricts prices from rising.
b. restricts prices from falling.
c. is below the equilibrium price.
19.
(A bit more challenging) The recycling station says it
will buy all our scrap aluminum for 19 cents per pound.
Its demand curve for aluminum is
a. upward sloping.
b. downward sloping, but very steep.
c. vertical.
d. horizontal.
20. (A new application) With a
nearly flat (or
horizontal) demand curve, a shift of the supply curve will
generate
a. a very small change in price
b. a very small change in output
c. a very large change in output
d. a and c
e. none
of the
above
1. c
6. d
11. d
16. c
2.
b
7. b
12. b
17. a
3. a
8.
b
13. b
18. b
4. b
9.
a
14. b
19. d
5. d
10. a
15. c
20. d
1. Suppose the market for home computers is initially in equilibrium.
a. What happens to Supply or Demand for each of the changes below (increase or decrease).
b. Illustrate each of these changes on separate supply and demand graphs.
(Draw a new graph to illustrate each new situation.)
c. How do these changes affect the equilibrium price and equilibrium quantity?
i. Computers become easier to use.
ii. The price of DRAM memory chips (a necessary component) falls.
iii. Software program prices rise.
iv. All college students are required to own personal computers.
v.
Doctors warn of health risks
from electromagnetic radiation from computer screens.