Phil Martinez, Lane Community College
PRODUCTION POSSIBILITIES
Perhaps the best and most
famous guns vs butter production possibilites analysis was given in a
speech to the American Society of Newspaper Editors on April 16, 1953,
by President (and Five Star General) Dwight D. Eisenhower when he
stated:
signifies in the final sense,
a theft from those who hunger and are not fed,
those who are cold and not clothed.
This world in arms is not spending money alone.
It is spending the sweat of its laborers, the genius of its scientists,
the hopes of its children ...
This is not a way of life at all in any true sense.
Under the cloud of threatening war,
it is humanity hanging from a cross of iron.
Instructions: Use the graphs below to answer the following questions.
1. Which graph below illustrates the impact of a hurricane on the productive capacity of an economy?
2. Which graph below represents the impact of an increase in the size of the cattle herd in an economy?
3. Which graph below illustrates the impact of rising unemployment and lay offs in an economy?
4. Which graph below represents the impact of an influx of immigrants entering the work force?
5. Which of the graphs below best represents the impact on production possibilities of a decrease in wasteful production and an increase in recycling rates?
6. Which graph below best represents the impact on an economy's production possibilities of a depletion of resources?
7. Which graph below represents the introduction of cloning technology, which allows the most production milk cows to be reproduced identically?
8. Which graph below represents an impossible increase in production possibilities?
9. Which graph best represents the impact on the production possibilities of the end of a war and the re-orientation of military production to civilian production?
10. Which Graph best represents the impact on the production possibilities of a Mad Cow Disease epidemic in a country's dairy herds which requires that all infected herds be destroyed and buried?
11. Suppose a country prepares to enter a war. How would this change be represented on a production possibilities curve?
12. Which graph represents the destruction of armaments and weapons production facilities at the end of a war?
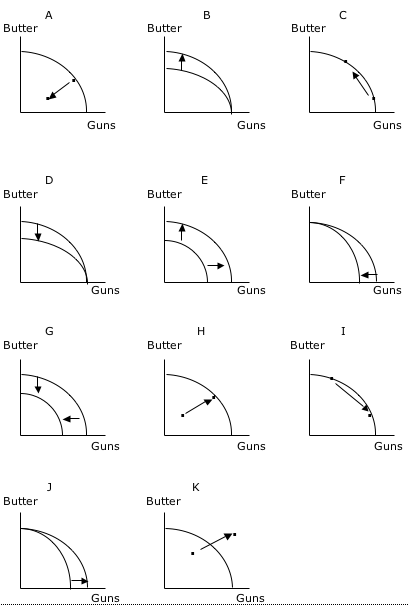
ANSWERS: 1. G; 2. B; 3. A; 4. E; 5. E; 6. G; 7. B; 8. K; 9. C; 10. D; 11. I; 12 F
