

Everything
you always needed to know about
Supply
& Demand Graphs*
(*but
never got around to asking)
Everything
you always needed to know about
Supply
& Demand Graphs*
(*but
never got around to asking)
The following notes outline fundamental elements
of the Supply and Demand graphs, which are rarely emphasized in most
principles level economics textbooks. All of the following points are
prominently covered in my lectures and exams.
1. Since the Supply and Demand graphs are mathematical models of specific marketplace interactions, and since these models have been intentionally constructed to highlight underlying economic principles, they have at least 4 levels of interpretation as:
i. Commonly observed behavior in the marketplace;
ii. Economic concepts and relationships;
iii. Mathematical relationships represented with graphs; and
iv. Mathematical relationships modeled with algebra and calculus.
For the introductory level courses only the first three of these are emphasized. Below are the interpretations of the basic elements of the Supply and Demand analysis.
DEMAND
i. Observed Market Behavior: The concept of "Demand" refers to the commonly observed relationship between the price of a good and the number of units a person is likely to purchase. Common experience suggests that when a good is relatively expensive a person is likely to buy less of it than when the same good is sold at a significantly lower price.
ii. Economic Concepts: This marketplace behavior has been formalized into economic terminology as The Law of Demand:
As the price of a good rises, an economically
"rational" consumer will
be able and willing to buy fewer units of the good, assuming
nothing
else is changing (e.g. income, other prices, et
cetera).
Of course, this "Law" also applies when prices
fall, resulting in the expectation that the rational consumer is
likely to buy more units of the good.
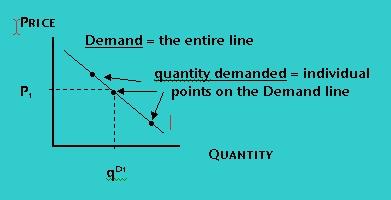
Economically, "Demand" (D) refers to the inverse relationship between the Price (P) of a good and the quantity of the good a consumer will purchase ("quantity demanded"). Demand is the various amounts of a good a consumer will consider buying, over a range of possible prices. The "quantity demanded" (qD) refers to the precise amount of a good a person actually buys at one specific price.
iii. Graphical Interpretation: Graphically, Demand is represented as a downward-sloping line. It is downward-sloping (from upper left to lower right) because it has a negative slope, since Price and quantity supplied are inversely related. By contrast, the "quantity demanded" of a good is a single point on the Demand line which indicates the exact amount of the good the consumer will purchase at a single, specific price.
SUPPLY
i. Market Behavior: The concept of "Supply" refers to the relationship between the price of a good and the number of units a producer is motivated to produce. Assuming that the producer is motivated only by making the maximum profit, when a good is relatively expensive a producer is likely to be motivated to produce more of the good, since she will make a larger profit at the higher price.
ii . Economic Concepts: This marketplace behavior has been formalized into economic terminology as "The Law of Supply":
As the price of a good rises, an economically
"rational" producer will
be able and willing to supply more units of the good, assuming
nothing
else is changing (e.g. income, input costs, materials,
technology, et cetera).
Of course, this "Law" also applies when prices fall, resulting in the expectation that the rational producer is likely to produce fewer units of the good.
Economically, "Supply" (S) refers to the positive relationship between the Price (P) of a good and the quantity of the good a producer will produce ("quantity supplied"). Supply is the various amounts of a good a producer will consider producing, over a range of possible prices. The "quantity supplied" (qS) refers to the precise amount of a good a producer actually supplies at one specific price.
iii. Graphical Interpretation: Graphically, Supply is represented as an upward-sloping line. It is upward-sloping (from lower left to upper right) because it has a positive slope, since Price and quantity supplied are positively related. By contrast, the "quantity supplied" of a good is a single point on the Supply line which indicates the exact amount of the good the producer will produce at a single, specific price.
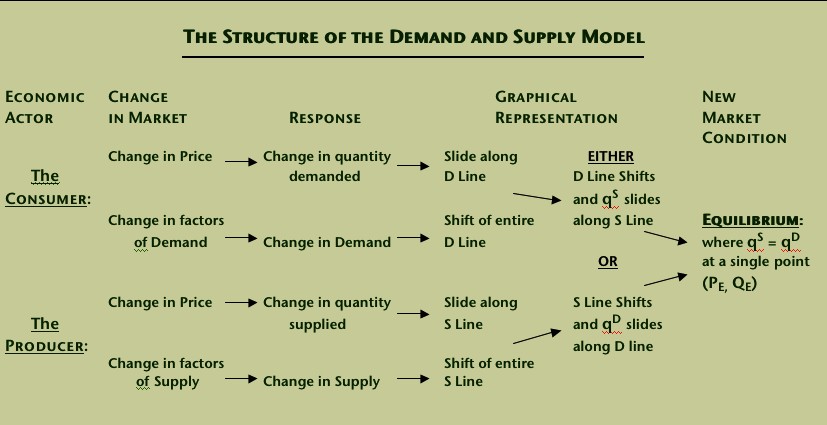
THE FULL SUPPLY AND DEMAND MODEL
SOLVING A SUPPLY & DEMAND PROBLEM
Solving a S & D problem is straightforward if you follow these steps:
Remember:
(i) this is a mathematical model, and thus, has a logically consistent method of solution. In other words, rely on the structure of the model, not on your intuition, nor on your interpretation;
(ii) that a single movement of either the S or the D line represents both the producer and the consumer acting. You will not need to move both lines in any problem in this course.
The Method:
Answer the following questions:
1. Who responds first to the market change identified in the problem, the consumer or the producer?
If the consumer responds first, then we know that the Demand line shifts.
If the producer responds first, then we know that the Supply line shifts.
Of course, you
determine who the primary actor is based upon
the factors of demand and the factors of supply identified in the text.
2. Does the change in the market identified in the problem result in the Equilibrium Quantity falling or rising?
If Quantity rises, then whichever line you identified in step 1 shifts to the right.
If
Quantity falls, then whichever line you
identified in step 1 shifts to the left.
3. Does the new equilibrium quantity and equilibrium price make sense? (Now is the time to rely on your intuition.) Since there are only four possible solutions - 2 lines each moving right or left only once - the incorrect answers usually make no sense based upon the market change indicated in the problem.
Possible Solutions:
There are only four possible solutions, and only one is consistent with each situation.
An increase in Supply…….shifts the S line …..to the right…...P falls & qD rises.
A decrease in Demand…....shifts the D line …..to the left…....P falls & qS falls.
A decrease in Supply……..shifts the S line …..to the left….....P rises & qD falls.
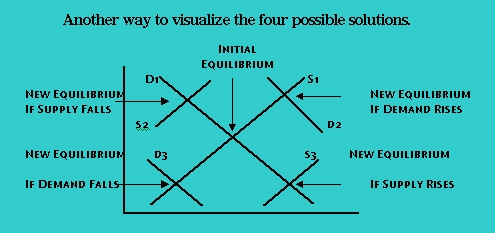
See the graphs below for examples. Note the four very different results we get when analyzing Supply and Demand.
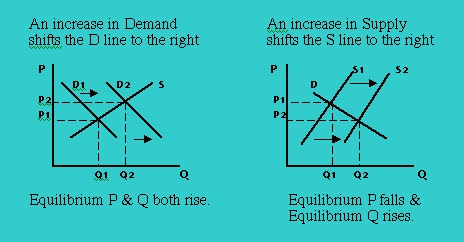
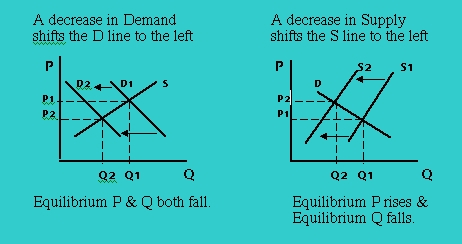
The diagram below summarizes the 4 possible solutions to a Supply and Demand problem.Given that nothing else is changing other than what is explicitly stated in the problem, either Supply or Demand will shift, but not both. Consequently, we can see that either an increase in Demand or a decrease in Supply will generate a higher price. However, note that when Demand rises not only does the Equilibrium Price rise, but the Equilibrium Quantity also rises, indicating that producers respond to the rising Price by increase the quantity of the good supplied to the market along the Supply line. In contrast, when the Price rises due to a reduction in Supply, the Equlibrium Quantity falls along the Demand line, as consumer respond to the rising price.
This webpage is developed and maintained solely by Philip R. Martinez.
Copyright 2003 Philip R. Martinez and Lane Community College.
All Rights Reserved