Review of Linear Slopes
Economists use graphs (linear and non-linear) to represent ideal relationships between 2 economic variables. This is one way to do economic modeling. In economic modeling we are not reporting factual information (data points), we are summarizing ideal, theoretical relationships.The relationship between the
price of a good and the amount that a consumer is able and
willing to buy (i.e. the Demand Line) is a negative or
inverse relationship, which is represented by a line (or convex
curve) that is downward-sloping from upper left to lower right.
It is a negative (or inverse) relationship because one of the
variables is negative while the other is positive. They move in
opposite directions. If price rises (grows positively), the
quantity demanded by consumers falls (moves negatively).
In contrast, positive or direct
relationships are represented as upward sloped lines, from
bottom left to upper right. This is because both variables
increase together OR decrease together. They move in the same
direction. The Supply Line is the most common economic example
of a positively sloped line. When the price of a good rises in
the market producers are motivated to produce more of the good
in order to make more profit per unit sold. So, both price and
the amount produced (the quantity supplied) increase.
Alternatively, if the price of the good falls, producers will
cut production since they now make less profit per unit sold, or
may even lose money at a lower price. In this case both price
and the quantity produced fall or move in a negative direction
together.
Flat versus Steep Slopes
A
negative-sloped Demand line that is relatively flat indicates
that consumers are very sensitive to small changes in Price and
respond with relatively large changes in their purchasing
behavior. Similarly, A postively sloped Supply line that is
relatively flat indicates that Producers are very sensitive to
small changes in in Price becasue they respond with a bigger
change in production.
How do we know this?Because a relatively flat Demand line indicates that a small change in the vertical variable (Price) corresponds to a larger change in the horizontal variable (Quantity). This is particularly clear when you compare a "flattish" Demand line to a steep Demand line, which shows that a large change in the vertical variable is associated with a small change in the horizontal variable.Of course, thesame comparison holds when you compare a flat Supply line with a steep Supply line.
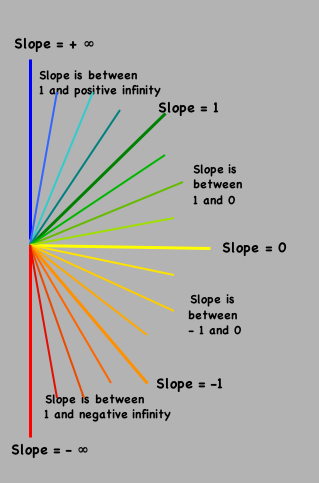
For example, compare the difference in the vertical to horizontal relationships of a slightly negatively sloped line (say a light yellow one) to a very steep negatively-sloped line (say the red-orange line). Also compare the difference in the numerical value of the slope of flat Supply line (light green) to a steep Supply line (dark blue).
Being able to visually intepret both the mathematical concepts of graphs, as well as, the economic meaning of the graphs is a useful skill for introductory economics students.
Copyright 2003 - Philip R. Martinez and Lane Community College.
All Rights Reserved.