
|
Phil Martinez |
PRODUCTION POSSIBILITY CURVES
|
Phil Martinez |
PRODUCTION POSSIBILITY CURVES
1. THE BASIC MODEL
i. Production Possibility Curves are the simplest way to represent the basic production decision: "How much of each good should be produced?"ii. The entire production system is represented by 2 alternative goods. Any combination(or "mix") of these 2 goods can be produced, within the limitations of existing resources and technology.
iii. This model illustrates the logically necessary and complex results that are fundamental to all orthodox economic analysis, specifically: every action, every decision, every good has a cost equal to the value of the lost opportunity of pursuing the next best alternative. This is the "opportunity cost" of the good and is often stated as "There Ain't No Such Thing As A Free Lunch".
2. ASSUMPTIONS
i. all resources are efficiently and fully used.ii. all technologies are efficiently used
iii. all technologies and resources are fixed along every individual curve.
3. THE CURVE
i. Production mixes outside the curve are not possible, they are unattainable, given existing resources and technology.ii. Production mixes inside the curve are inefficient, since resources (including labor) and/or technologies are under-utilized. If resources and technology were utilized fully and efficiently to produce both goods the production mix would be on the curve.
iii. Production mixes on the curve represent all of the possible mixes of maximum output for both goods. Here all resources and technologies are fully and efficiently used.
4. LINEAR PP Graphs: CONSTANT TRADE-OFFS or FIXED RATIO PRODUCTION.
Example A: Manufacturing "Male Frame" vs. "Female Frame" BikesThe production trade-off is constant (1 to 1), regardless of the quantity produced.
Producing one additional Male-frame bike requires giving up one Female-frame bike, since they use the identical combination of material resources, tools, and labor. This is exactly a 1-to-1 tradeoff, so the slope is - 1 (negative 1). To gain one additional Male-frame bike one Female-framed bike must be cut from production.
Example B: Manufacturing Standard Bikes vs. Tandem Bikes
The production trade-off is constant (1.8 to 1), regardless of the quantity produced.
Producing one additional Tandem bike requires giving up almost two (1.8) Standard bikes, since they use different combinations of the same material resources, tools, and labor. This is a 1.8-to-1 tradeoff, so the slope is steeper (-1.8).
5. CONCAVE PP Graphs: INCREASING TRADE-OFFS.
Linear Production Possibilities Models are overly simplistic, and provide no particularly useful insights.For economic analysis, the most useful Production Possibility Curves are concave (they bow outwards). These models capture the fact that most production (and economic) decisions require increasing tradeoffs. This occurs because resources and technologies are not perfectly transferable.
Since the usefulness and efficiency of resources and technologies differ from product to product, continuously increasing the production of one good at a constant rate (say one unit of output at a time) requires giving up production of the second good at an increasing rate (say 1, 2, 4, 8, 16). So, you must give up increasingly more units of the second good, to continue increasing the production of the first good at a constant rate.
Increasing tradeoffs are one of the most fundamental and important concepts of orthodox economics. Increasing tradeoffs can be explained at least 2 ways: Decreasing Marginal Product (or Benefit), also known as Decreasing Returns, and Increasing Marginal Costs. These are always associated with each other. If one exists the other must also exist.
Law of Decreasing Marginal Product: Given static resources and technology, transferring resources at a constant rate from the production of one good to the production of another good results in a decreasing rate of new production of the second good.
Law of Increasing Marginal Cost: Given static resources and technology, increasing the production of one good at a constant rate requires transferring resources from a second good at an increasing rate.
6. INCREASES IN RESOURCES OR ADVANCEMENT OF TECHNOLOGIES.
A. An increase in a resource or technology that is equally productive to both goods would increase the maximum possible output of each good proportionately, as in Example A below.
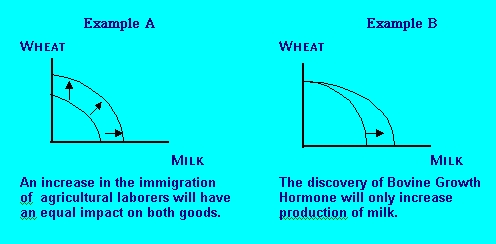
B. An increase in a resource or technology that is exclusively efficient for one of the goods will increase the maximum potential output of only that good, and have no impact on the alternative product, as in Example B above.
7. LOSS OF RESOURCES OR TECHNOLOGY
C. The maximum possible output will decline for both goods, only if there is some loss of a resource that is fundamentally necessary for both, or if technology is destroyed or somehow lost and forgotten. The only possible examples of these are resource depletion and catastrophes due to natural disasters or war. See Example C below.
D. The loss of a resource or technology that affects only one of the goods is represented by the potential maximum output of that specific good decreasing with no impact on the other good. As in Example D above.
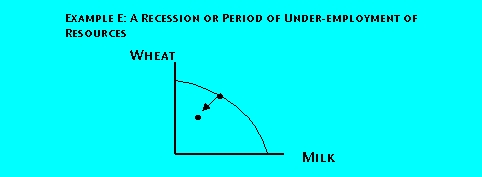
E. Since the interior of the Production Possibility graph represents inefficient use of resources or underemployed resources, a Recession or a drop in production, due to a recession would be represented by a movement from some individual point on the Production Possibility Curve (representing where the economy was or where it could have been producing at its peak efficiency) to an individual point under the curve. Note that in this case although production has dropped, the economy's capacity to produce has not decreased, since no resources nor technology were destroyed. See Example E below.
8. COMMON APPLICATIONS
The Production Possibility Model is commonly used to illustrate:
F. "Guns and Butter"This model illustrates the social trade-offs that every society inherently makes when it chooses to dedicate expenditures for military and security purposes versus spending that money on current standards of living.
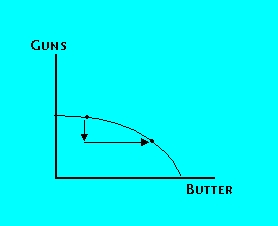
Perhaps the best and most famous "guns versus butter" production possibilities analysis was given in a speech to the American Society of Newspaper Editors on April 16, 1953, by President (and Five Star General) Dwight D. Eisenhower when he stated:Every gun that is made, every warship launched, every rocket fired signifies in the final sense, a theft from those who hunger and are not fed, those who are cold and not clothed.This world in arms is not spending money alone. It is spending the sweat of its laborers, the genius of its scientists, the hopes of its children ...
This is not a way of life at all in any true sense. Under the cloud of threatening war, it is humanity hanging from a cross of iron.
ii. Private Goods and Public Services
Any increase in public services implies that there must be loss in private sector goods, since the people, resources, and technology employed by the government are not available for private production. This assumes, of course, that there is no unemployment in the economy. Additionally, it may be that the government can provide particular services far more efficiently than the private sector. National Security, Consumer Rights, Truth- In- Lending laws, Courts of Law, et cetera, are some examples. These are called "public goods".

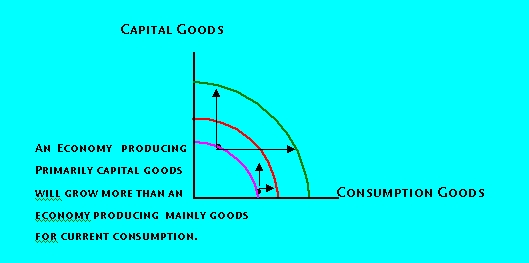
iii. Capital goods and Consumption goods, and Future Production.Any resources that are spent on producing goods for current consumption, are not available to produce technology and machinery (capital goods) to be used from the future production of goods. Thus, every good produced for current consumptions diminishes the maximum potential growth of the future.
Copyright (2003) Philip R. Martinez and Lane Community College.
All rights reserved.