Some Results from SQ 2 & 3
(LECTURE 3B follows the results.)
For which of the following nutrients was your intake BELOW the “Recommendation or Acceptable Range”?
| Spring 2009 | Winter 2010 | Fall 2010 | Fall 2011 | Spring 2011 | |
| Protein | 12% | 12% | 24% | 35% | 23% |
| Total Fiber | 46% | 61% | 62% | 71% | 61% |
| Saturated Fat | 12% | 23% | 15% | 32% | 18% |
| Vitamin E | 62% | 70% | 79% | 74% | 67% |
| Vitamin B6 | 27% | 30% | 44% | 32% | 25% |
| Vitamin B12 | 27% | 35% | 41% | 45% | 25% |
| Calcium | 19% | 53% | 62% | 74% | 49% |
| Magnesium | 38% | 51% | 62% | 55% | 39% |
| Iron | 38% | 58% | 56% | 65% | 52% |
| Zinc | 15% | 39% | 44% | 32% | 25% |
| Selenium | 12% | 14% | 18% | 29% | 21% |
| Potassium | 50% | 74% | 74% | 74% | 67% |
| None of the above. I was above my “Recommendation or Acceptable Range” for all nutrients.
|
12% | 2% | 9% | 0% | 2% |
Which groups were you below "100 Percent Recommendation"? (Select all that apply.)
| Spring 2009 | Winter 2010 | Fall 2010 | Fall 2011 | Spring 2011 | |
| Milk | 50% | 67% | 68% | 74% | 66% |
| Meat & Beans | 54% | 51% | 50% | 61% | 41% |
| Vegetables | 58% | 61% | 76% | 74% | 64% |
| Fruits | 50% | 65% | 68% | 68% | 67% |
| Grains | 35% | 47% | 47% | 58% | 49% |
| None of the above. I was above "100 Percent Recommendation for all groups.
|
4% | 2% | 6 % | 3% | 2% |
|
FN 225: Nutrition
LECTURE
3B: Wilbur and Solar PowerRathakette, Ph.D. Health Professions Division Lane Community College Eugene, Oregon |
|
The Lectures NEXT week (Week 4) are longer than usual, so please plan your time for next week accordingly. FORUM:
For this lecture, have in front of you the "Wilbur Drawing" and "Your Notes about the Wilbur Drawing" and "Wilbur and Solar Power" in the lecture outline for Chapter 4-1 (which you can print off of moodle). The "Wilbur Drawing" in your lecture outline is subtitled "How Energy Goes from the Sun to Human Cells". I will be using corn as a specific example of this, but it's what happens in all plants. It's sort of hard to read the bottom of the "Wilbur Drawing. It says in cells everywhere in body .

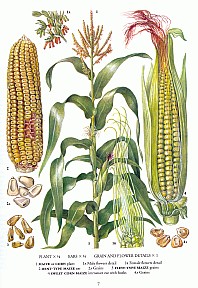
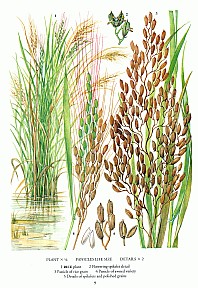
I chose corn because it's a crop native to the Americas. The illustration on the right shows rice, which would be better used to illustrate this process if we were in Asia. The other book I used was Isaac Asimov's book Photosynthesis . He was a Russian-born biochemist and writer who died an American in 1992. 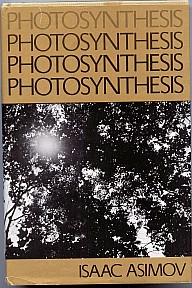
5 steps of the Wilbur Drawing
The two videos below will explain these 5 steps in more depth. |